|
L'aide française est disponible au format PDF en cliquant ici (ou dans le Menu "Démarrer", Finale 2010, Documentation PDF française)
Le tutoriel français est disponible au format PDF en cliquant ici.
La mise à jour de l'aide française au format HTML sera disponible prochainement.
|
Traduction française :

|
Creating a decrescendo 

Now that you have some understanding of captured MIDI data, let’s try manipulating this data.
- On Windows, click on the Window menu and choose Advanced Tools Palette.
- Click the MIDI Tool
 . A new menu appears, called MIDI Tool.
- Drag a box around the first two measures (in both staves) to highlight them. Be sure to drag-enclose the full measures (up to the barlines). Remember, you can double-click any selection including a partial measure to expand the selection to include full measures.

Selecting music with the MIDI Tool is exactly like selecting music with the Selection Tool. Select a single measure by clicking it once; several onscreen measures by drag-enclosing any part of them; a long region by clicking the first measure, scrolling to the last measure, and  -clicking the last measure; and an entire staff by clicking to the left of the staff. You can also select the entire piece by choosing Select All from the Edit menu.
If you take a look at the commands in the MIDI Tool menu, you’ll notice that there appear to be three different elements you can edit: Key Velocities (how hard the keys were struck, which usually determines their volume); Note Durations (how long they were held down); and Continuous Data (pedaling, pitch bend, patch changes, and the like). Be sure that Edit Key Velocities is selected.
To show you the power of the MIDI Tool, you’ll create a decrescendo over the first two measures, even though there’s now a crescendo when they play back.
- From the MIDI Tool menu, choose Scale. The Scale dialog box appears. The Scale command lets you program a gradual change from one dynamic level (or duration or MIDI controller setting) to another. For this reason, it’s ideal for creating a smooth crescendo or decrescendo.
- MIDI key velocity is measured on a scale from 0 to 127; 127 is the hardest (loudest) attack.
- Type 120 in the first box. Press Tab, and type 30 in the second box. Click OK. You’ve just told Finale to decrease its volume over the course of the two selected measures. Try it:
- While pressing the Space bar, click measure 1 to play back the music. You should hear a steady decrescendo that lasts for the first two measures. If not, be sure you’ve made the changes to the Playback/Record Options described in the introduction to this section.
NOTE: Some MIDI keyboards don’t respond to key velocity information at all. If the volume or timbre of the notes on your keyboard doesn’t vary with the force you use to strike them, the keyboard is not “touch-sensitive.” Unless you want to take this opportunity to connect a velocity-sensitive MIDI keyboard, skip ahead to Editing Note Durations (Start and Stop Times).
Being able to scale performance data in this way may be useful, but it’s not very interactive—you can only tell what changes you’ve made by listening to the music. Fortunately, you can also see the changes you’ve made.
- Click anywhere on the screen to halt the playback.
- Drag a box around the first two measures in the top staff only.
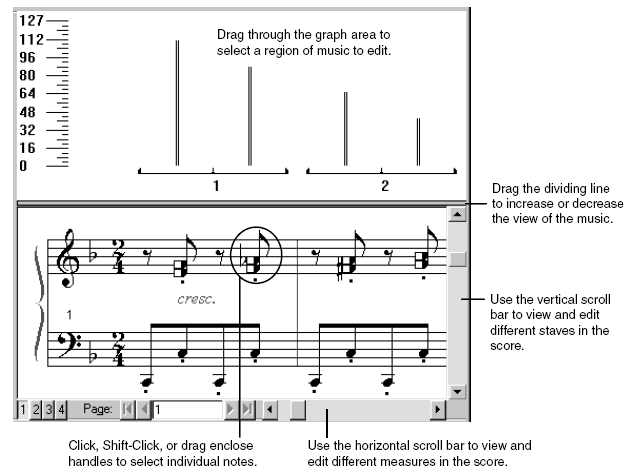
- Double-click the first highlighted measure. The MIDI Tool split-window opens. On Macintosh, this is a new separate window. In this window, you can only edit the captured MIDI information for one staff at a time. If you want to edit data on several staves simultaneously, therefore, don’t open the MIDI Tool split-window—just use the menu commands after selecting the desired staves.

At the bottom of the window, you’ll see the notes in the measures you double-clicked. Above them is a graph. Each bar of the graph corresponds to the key velocity (volume) of the note directly below it. Along the left side of the window you can see a legend of velocity values, scaled from 0 to 127.
You can immediately see the effects of your Scale command—the bars representing the key velocities grow steadily shorter over the first two measures. As an experiment, let’s now make the second half of the phrase crescendo. You may need to move the display so that you can see measures 3 and 4; if so, click the arrow buttons (on Windows, use the scroll bar at the bottom of your screen).
- If you cannot see measures 3 and 4, click the right horizontal scroll bar arrow until measure 3 is at the left side of the window. A measure number appears in the middle of each measure, between the notation display and the graph area.
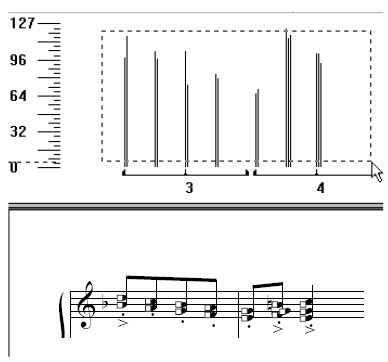
- Click in the graph area at the beginning of measure 3, and drag to the end of measure 4, like this:

Any region you select in the graph area automatically selects the handles of the corresponding notes below it.
- From the MIDI Tool menu, choose Scale. Type 30, press Tab, and then type 120. You’ve just programmed a crescendo for the second half of the phrase.
- Click OK. Whenever you’re working in the MIDI Tool split-window, you can always get a quick playback of the displayed music:
- From the MIDI Tool menu, choose Play.
 Previous Previous
|
Next  |


 -clicking the last measure; and an entire staff by clicking to the left of the staff. You can also select the entire piece by choosing Select All from the Edit menu.

